I suggest you make a visible light spectrometer yourself (spectrophotometer).
Do it yourself => DIY => Do It Yourself. To make it, you just need to know how to use a soldering iron, have access to a 3D printer to make the case but especially the white diffuser.
This spectrometer is not made to measure the color of an object or a liquid but the color of a light source via an AS7341 sensor. The measurement is done in incident light, that is to say that the spectrometer must be directed towards the light source.
This spectrometer can also provide other information:
Like exposure in continuous light for measure illuminance (light meter mode).
White balance.
The CRI (Color index renderer)
The chromaticity coordinates of the light source on the CIE1931 diagram as well as its DUV (UV delta of the CIE 1960 standard)
The calculation of CTO and CTB gelatins
The depth of field
The exposure with a flash (flash meter mode).
I will detail each function later.
This spectrometer uses an AS7341 sensor to measure light. It is an 11-channel sensor (8 channels between 380 and 780 nm) which makes a measurement every 50nm on average.
A sensor at 350 Euros minimum (just the price of the sensor) will make a measurement every 15nm, and a sensor that makes measurements every 2-5nm will cost much more.
Since the AS7341 makes a measurement every 50nm or so, it will not allow you to represent the peaks or lines of the wavelengths but will still give you a very good representation of the curve of the light source for about 10 Euros per sensor. But you will be surprised by its measurement accuracy, I estimate its error rate at about 1%.
Important information! The AS7341 sensor has a particular operation. It reads the 11 channels in two stages. Because of this mode of operation, the first measurement may be false while you position the sensor without moving it towards the light source. You must therefore wait for a second reading cycle to have a correct measurement. Below 20 lux, the integration time becomes important, in this case you will have to wait several seconds to have the correct measurement. Above 20 Lux a measurement is made approximately every half second. When the AS7341 changes the integration time and/or gain for the measurement, the information « RANGE » appears on the LCD screen. Below 15 Lux, the measurements become increasingly imprecise.
The microcontroller I chose is a XIAO ESP32S3. I made this choice for several reasons: its small size, its dual core at 240 Mhz for calculations, its ability to charge a 3.7V LIPO battery via a USB-C port, its very low consumption in standby mode (the complete assembly consumes only 18 uA in standby mode), the future possibility of using Bluetooth or WIFI. For the display I chose a 3.5-inch LCD of 320 x 480 pixels, which is sufficient to display all the information, but is neither too small nor too large. This LCD is a capacitive touch screen. Resistive touch screens require the use of a stylus, which is not practical, capacitive screens like our Smartphones are much better suited.
In the ZIP file that I give the link at the bottom of the page, you will find the tutorial for making this spectrometer but also a tutorial for doing the calibration and lots of other information such as the files for printing the 3D case, making the printed circuit, the list of components, the soldering and manufacturing instructions and of course the program for uploading the firmware to the microcontroller.
IMPORTANT !! I do not provide the source code of this spectrometer, only a program for uploading the firmware to the ESP32S3 via the USB port. So do not ask me for the source code.
The firmware is the main program that allows this spectrometer to work using a XIAO ESP32S3 and an LCD equipped with an ILI9488 display controller and a CTP 6236 touch controller.
The head containing the AS7341 sensor is rotatable, this allows the head to be directed towards the light source to take the measurement.
There is a USB-C socket to charge the battery and a push button to turn the spectrometer on / off but also to pause it.
To turn on the box, a simple press on the push button on the right is enough.
To pause / store a measurement, briefly press the push button, another press removes pause.
Pressing the push button for 3 seconds puts the box in deep sleep mode.
For all other interactions with the box, the screen is touch-sensitive.
NB: If no action, no pressure on the touch screen, is made for 5 minutes then the box automatically goes into deep sleep mode.
Its cost to make (by yourself) is around 70 – 80 Euros.
Please refer to the list of components and the manufacturing tutorial contained in the ZIP file indicated at the bottom of the page for more information.
If you need to learn how to use a soldering iron because you will have to solder components, there are tutorials on the internet for that. I reassure you it is really not complicated.
I have not even visually presented this spectrometer to make by yourself!
So here are some pictures
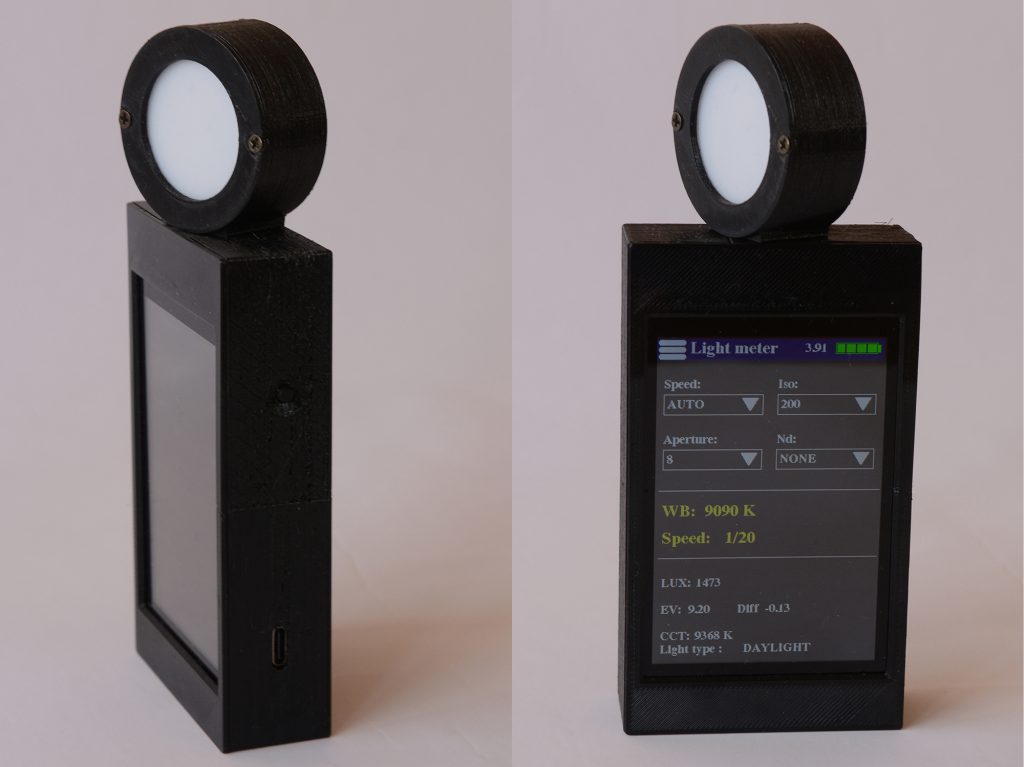
When you turn on the spectrometer, you arrive by default on the light meter window.
This is the window that we will probably use most often since it groups together all the information to have a good exposure and white balance.
Light meter mode :
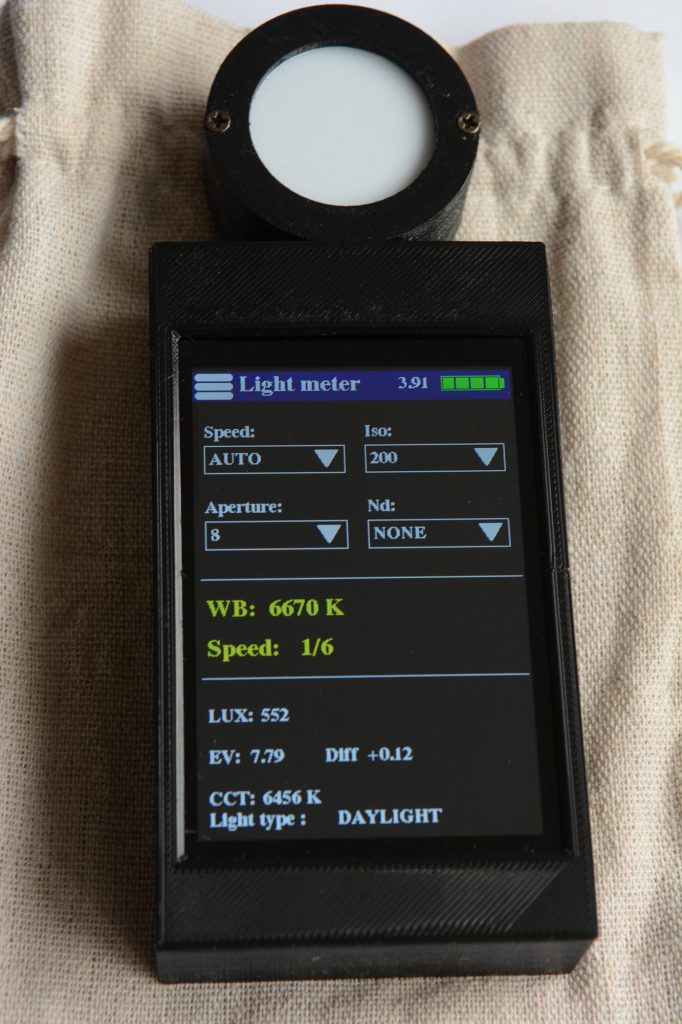
In photography, we consider that a good exposure is when the histogram of a gray photo at 18% (gray chart) is right in the center of the histogram. Thus the whites are not burned and the blacks provide details. For the white balance, it is the same thing, the histogram of the red, green and blue components must be in the center for an image at 18% gray.
Exposure, in photography, is calculated via a triplet: speed, aperture and sensitivity.
At a given time, there can be only one of these values that can be in automatic mode.
In the photo above, it is the speed that has been set to « AUTO », but it is quite possible to change and set the aperture or ISO. To do this, click on the « ISO » value for example, a drop-down list appears. At the beginning of the ISO list, you will find « AUTO », click on it, it is now the « ISO » that are in automatic mode.
In the upper part of the photo above, there are 4 settings, the speed, the ISO, the aperture but also the use of an ND filter (neutral density filter to make long exposures).
On the window of the photo above, in the middle and in yellow, we have the value of the standardized white balance so that a white is white regardless of the color of the light source, we also have the value of the speed since it is what we put in « AUTO », if it was the aperture that we had put in « AUTO » we would have the value of the aperture in yellow.
In the lower part, we have additional information such as LUX, EV (exposure index), color temperature (or white balance) not standardized.
I also added the type of light. To determine the type of light I created a small AI (artificial intelligence). It is possible that for some light sources I give wrong information because my AI training dataset is not huge. But the results are pretty good. Anyway, it is just one information without much importance.
The menu and the choice of functions :
The screen is a capacitive touch screen (like your smartphone), so no need for a stylus, just a tap of your finger.
Pressing the burger menu at the top left displays the function selection menu.
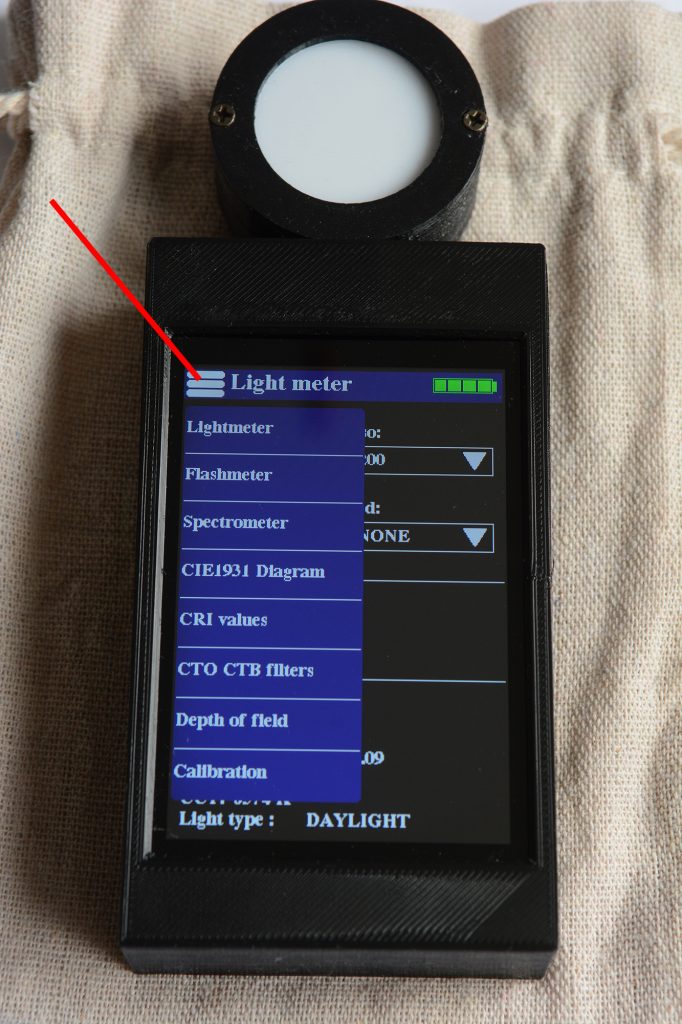
Spectrometer mode :
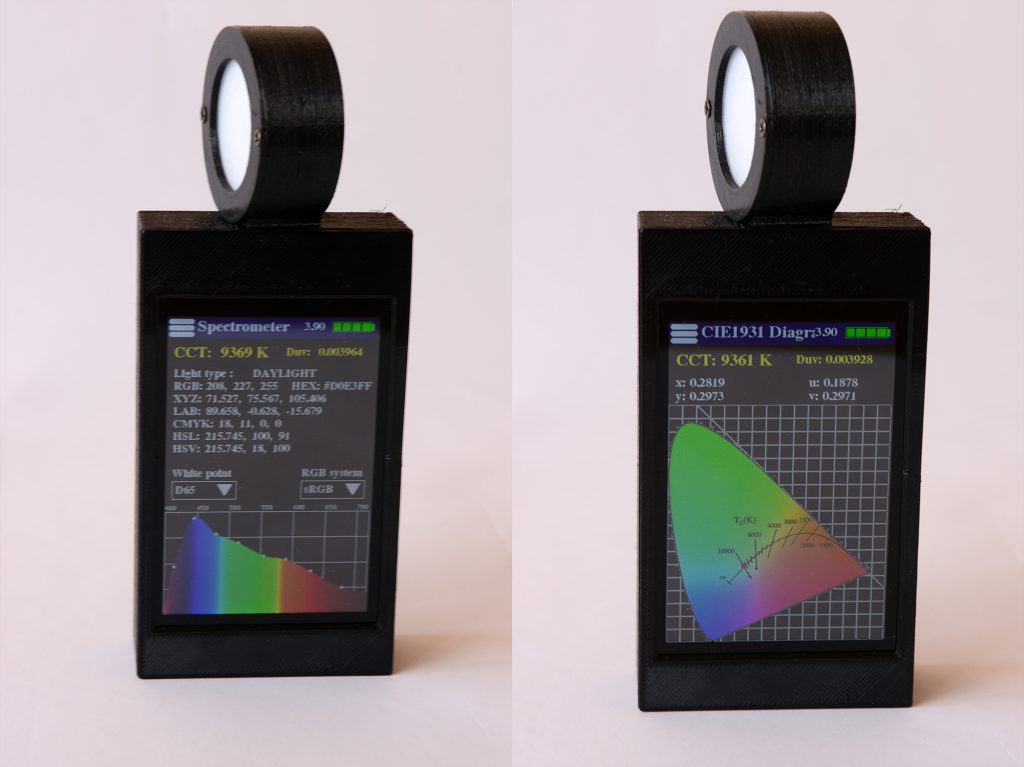
In the menu, click on the “Spectrometer” option, the following window appears.
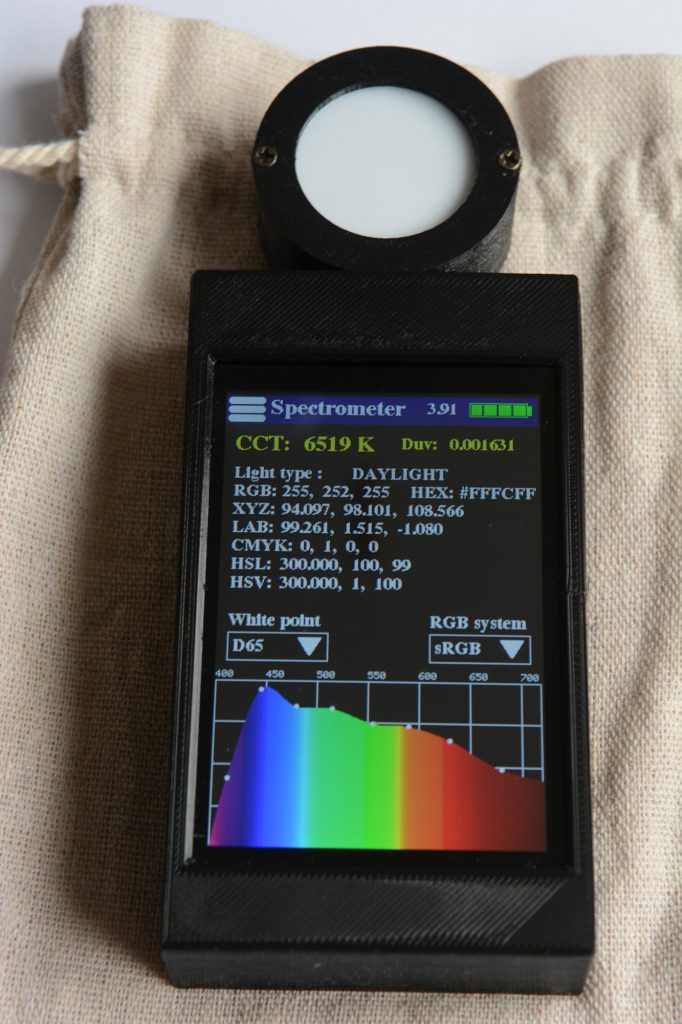
In the « Spectrometer » function, there is a lot of information that can be useful.
In yellow the color temperature (CCT) and the DUV.
We will also find the type of light source, the CCT values in different color models such as RGB, Hexadecimal, XYZ, LAB, CMYK, HSL, HSV.
These values can be used in image processing software such as Photoshop to reproduce the color temperature of the light source for example.
We can choose our white point (D50 – D65) for the different color models as well as the RGB system (sRGB or Adobe RGB).
Here is the spectrum of two other light sources, a warm LED light and a cold LED light
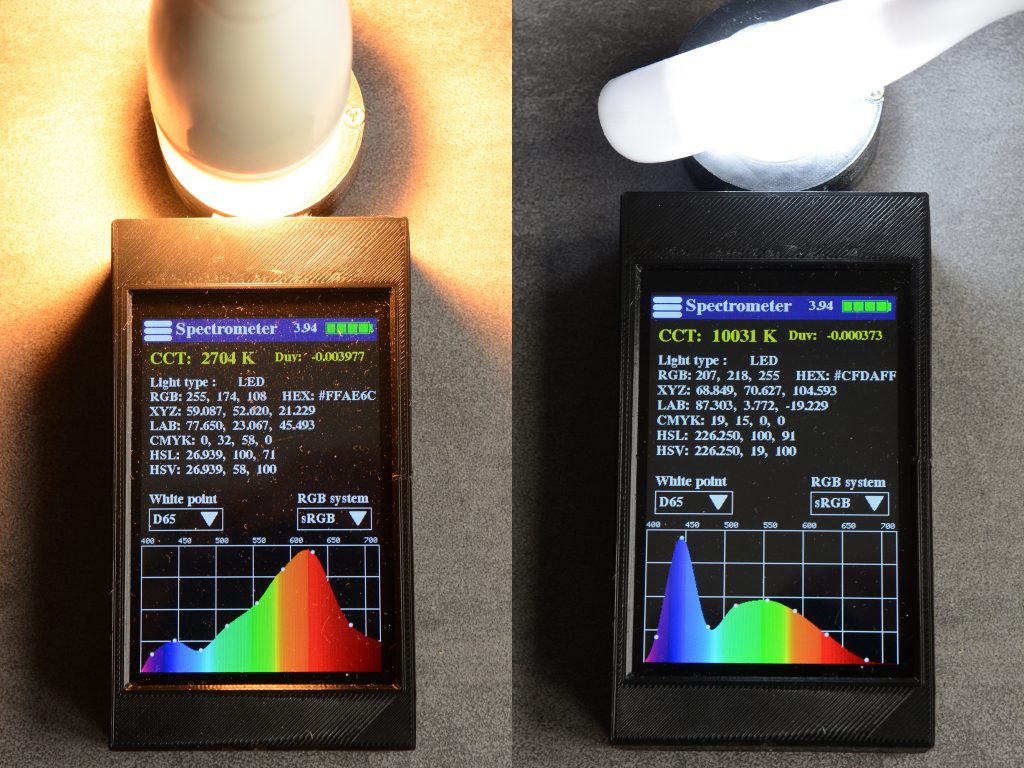
As I said at the beginning of the article, with a 10 euro AS7341 sensor, we do not have the same precision as with a 350 Euro or 500 Euro or more sensor.
With the AS7341, we do not see the peaks or lines as with a high-end spectrometer but only a curve reconstructed from the 8 points or channels of the visible spectrum of the AS7341 sensor.
The 8 white points on the curve are the values of the 8 channels of the visible spectrum of the AS7341
But I reassure you, the results are very good, we can see the main peak in the blues of an LED light very well, especially for the cold color source, and the measured values are accurate to about 1%.
CIE1931 Diagram mode :
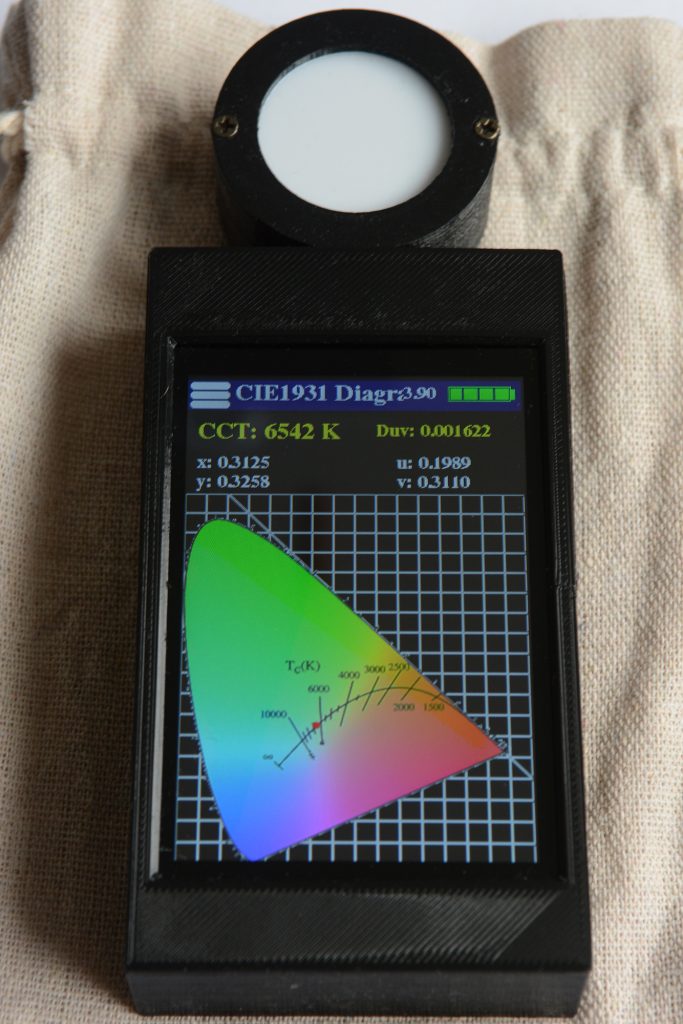
The CIE1931 mode allows you to view the chromaticity coordinates of the CCT or color temperature but especially the DUV.
The DUV is the distance between the curve of a perfect black body and the light source.
The smaller the DUV, the better the quality of the light source and the closer it is to the black body curve.
The larger the DUV, the further away we are, either towards green or towards violet. This will allow you to determine the dominance of the light source (green or violet).
In yellow, we have the color temperature and the DUV value.
We also find on this window the CIE1931 xy coordinates and the CIE1960 uv coordinates.
CRI mode :
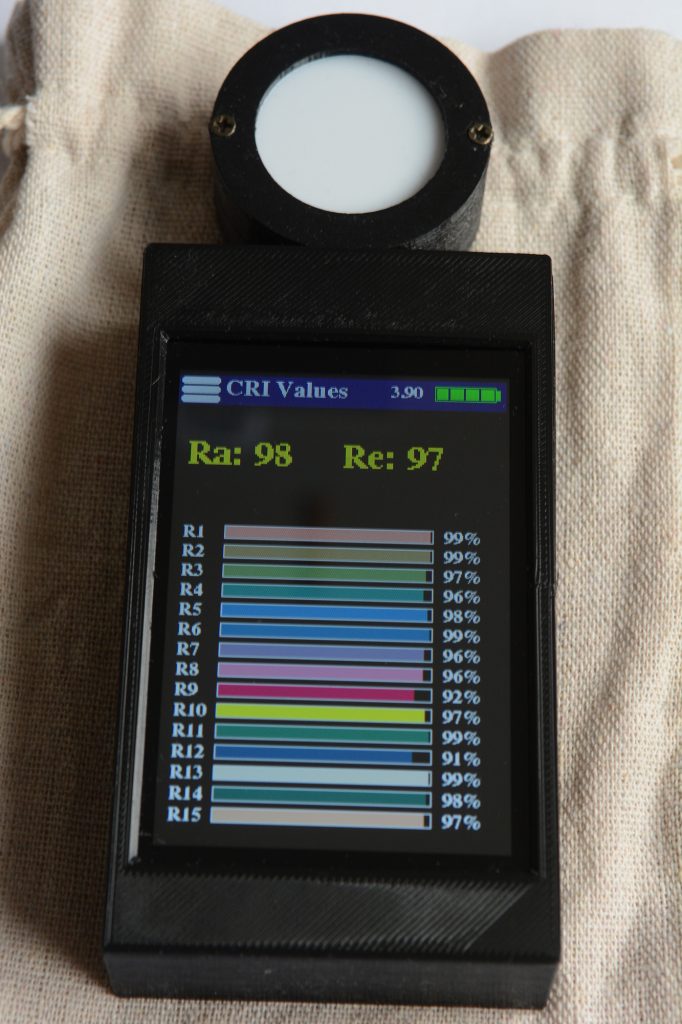
This window allows you to determine the quality of a light source in addition to the DUV.
A good light source will have a very low DUV and a very high Ra – Re but not only that…
Here is the CRI of a 2700K LED bulb
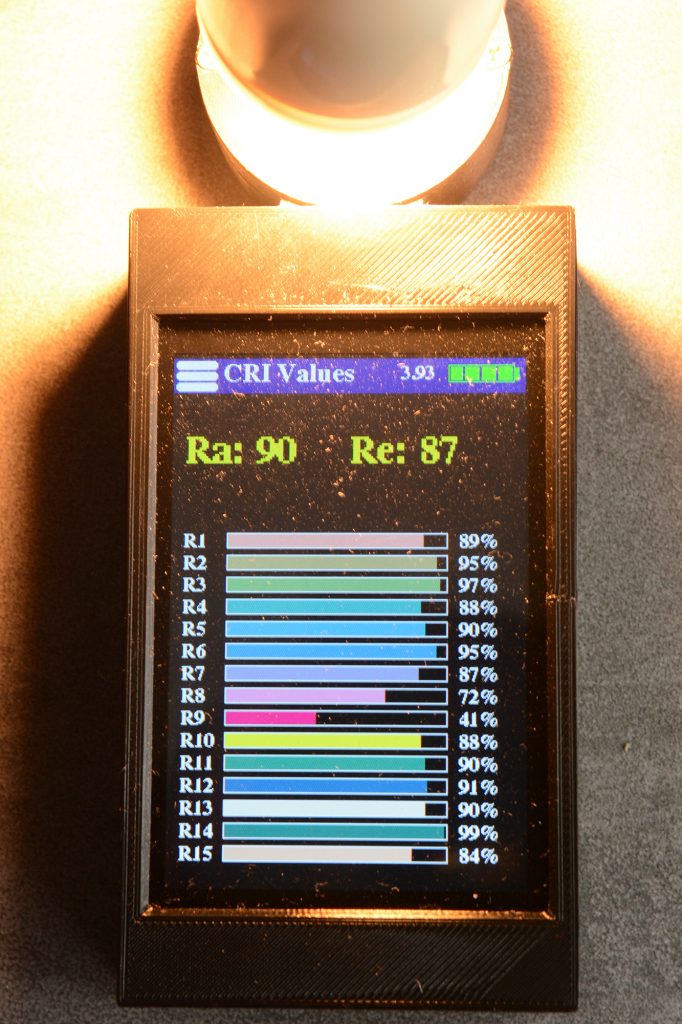
A Ra of 90 is correct but still far from 96 or 99% of an excellent light source.
On the other hand, we can clearly see that R9 is quite low (41%), this indicates that this light source will be bad at faithfully reproducing the color red. Thus, with this light source, you risk having a red garment or object that will appear more faded, orange, ….
So knowing the CRI of a light source is important information if you want to faithfully reproduce a color but the most important thing is not the Ra or the Re but the values from R1 to R15. A value between 90 and 100% is very good for this color.
Standard commercial bulbs often have a Ra of 80-85.
Below 80, they are considered bad for color reproduction.
Above 90 they are considered very good
Above 95-96 they are excellent bulbs, they are often full spectrum bulbs. Natural light has a Ra close to 100% in daylight.
CTO CTB Filters mode :
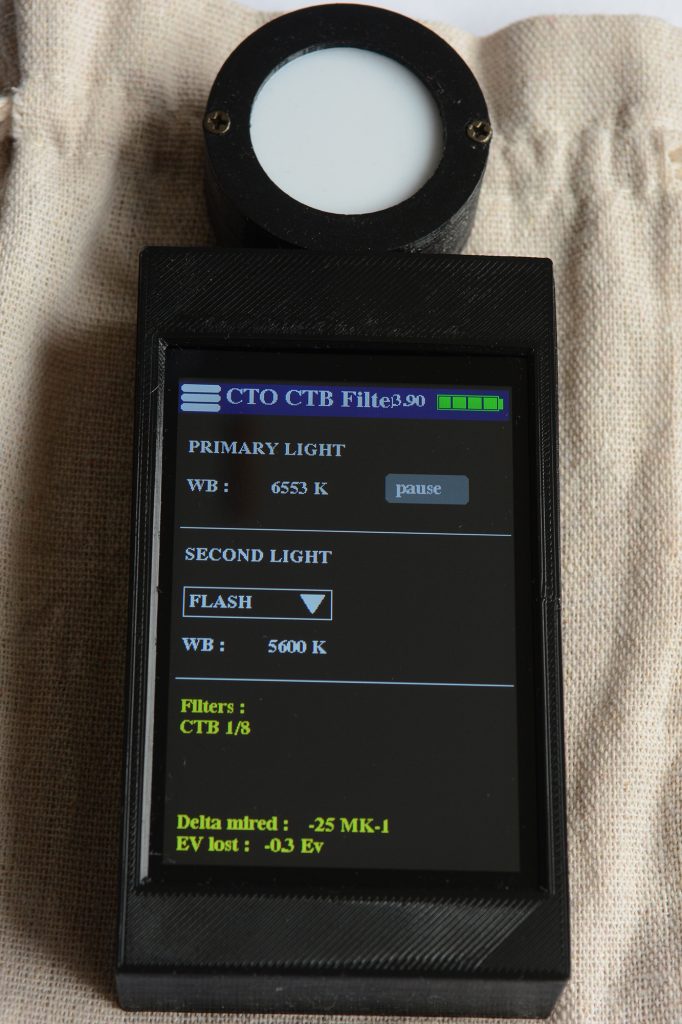
This window is really interesting if you want to use several light sources with different CCT (color temperatures).
CTO and CTB are gelatins (calibrated orange or blue transparent plastic sheets).
These gelatins are used to correct the color temperature of a light source.
CTO => Color Temperature Orange
CTB => Color Temperature Blue
They are standardized: Full, ½, ¼ and 1/8.
You can combine several gels like a full + a ¼ + a ½ to have a 1 + ¾ gel
But each time you put a gel on a light source, you lose a little exposure of this light source.
The window of this function allows you to compare two sources each time.
« Primary Light » is the main source, or if you use a continuous light source and a flash it will be the continuous light source.
Once you have measured « Primary Light » for a few seconds, press the « Pause » button to freeze the value.
By default, « Second Light » is set to « Flash » but you can choose another continuous light source to measure, in this case there will be a second « pause » button.
For « Flash », I do not measure the CCT because the AS7341 sensor cannot measure flashes, flash is too fast. And then, by default, the CCT of a flash is always around 5600K.
The gel will be applied to the second light source (« Second Light »), never to the first.
In yellow you will have all the information. In the example window above, I would have to apply a CTB gel of 1/8 on the flash to match the continuous light of 6553K.
I give the exact value of the Delta Mired between the two sources, this can be useful for certain gels.
We also see that I would have a loss of -0.3Ev, this means that I will have to increase its power by 0.3Ev on my flash.
Depth of Field mode :
This mode allows you to determine the depth of field.
It is an interesting information for a photographer to know the depth of field.
This is the case when taking close-up photos, in the studio, for landscapes it is not very useful.
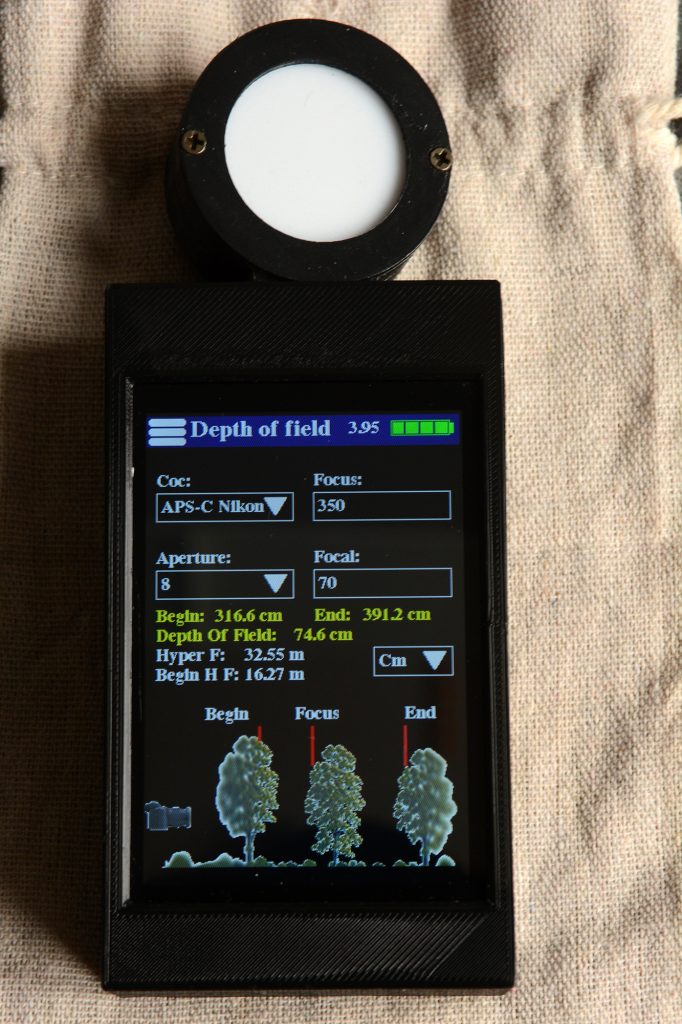
In this window, you indicate the type of camera sensor you have (APS-C, full frame, …), the distance (Focus), the aperture (Aperture) and the focal length you use on your lens.
You can specify the unit used for the distance (focus) the values calculated in centimeters, meters, inches and feet.
In yellow, you will have the information of the start of sharpness, the end of sharpness and the total distance of the sharpness zone.
There is also the hyper focal distance (Hyper F), the hyper focal is the distance at which you must focus if you want everything to be sharp in your photo (so no more bokeh due to the depth of field) from the beginning of the hyperfocal (Begin H F) to infinity.
Flash Meter Mode :
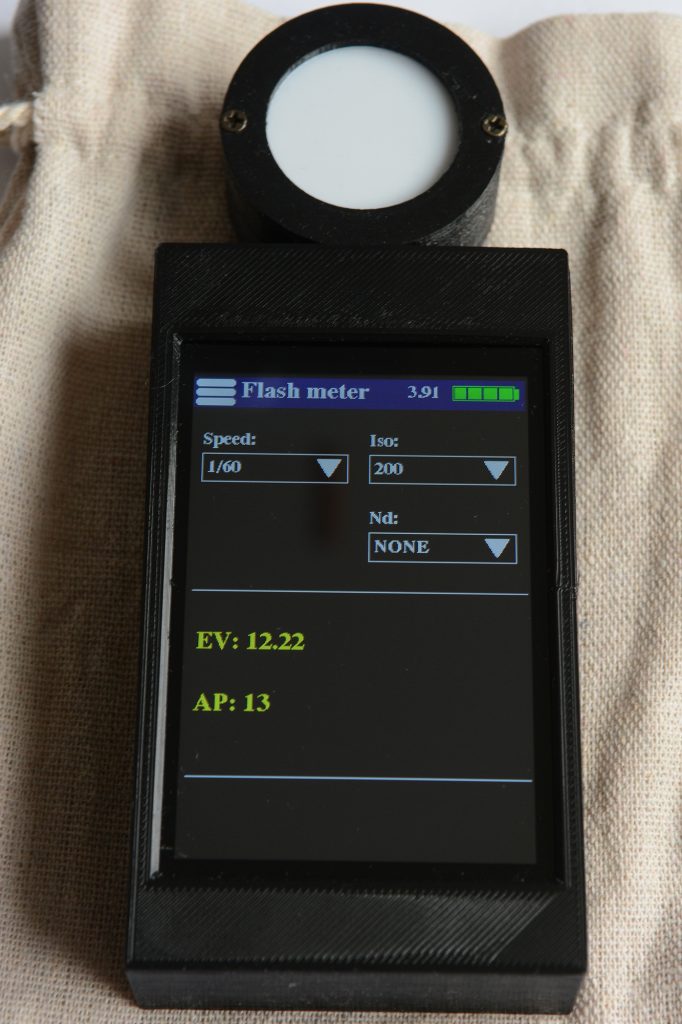
This mode allows you to correctly measure the exposure with a flash.
Indicate the synchronization speed of your flash. By default, it is often 1/60s, but in some cases, when using studio flash for example, you can have sync speeds of around 1/200s or 1/250s.
Indicate the ISO sensitivity that you have set on your camera.
If you are using an ND filter, indicate its value.
All that remains is to trigger the flash to take a measurement.
In yellow, we can see the EV value (exposure index) and the aperture value that you will need to set on your camera to have a good exposure.
Menu Calibration :
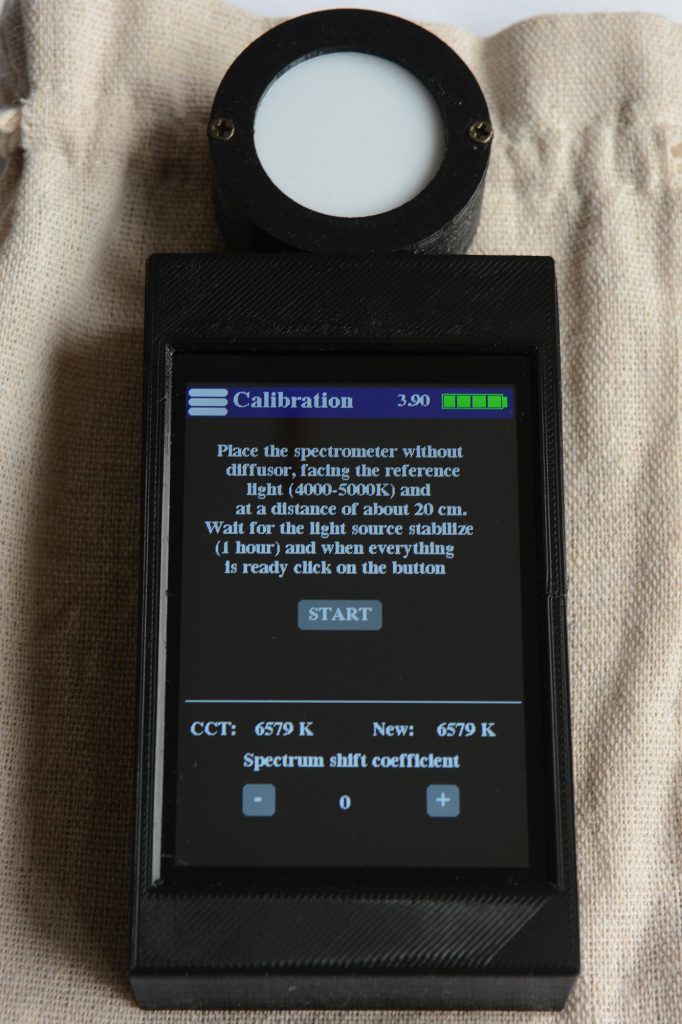
This last menu is the calibration menu. It is necessary to calibrate the diffuser.
As you are going to print it with a 3D printer, the filament you are going to use will not be the same as mine: material (PLA, PETG, ABS), color (depending on the manufacturer and the bath), thickness.
So you will have to calibrate your diffuser for the first time.
NB: the diffuser is absolutely necessary because the photodiodes of the AS7341 sensor are contained in rods that have a fairly narrow angle. So without diffusers, the measurements may not be constant depending on the angle in degrees relative to the light source.
In the ZIP file that I give the link to at the bottom of the page, you will find the tutorial for making this spectrometer but also a tutorial for doing the calibration and lots of other information such as the files for printing the case, making the printed circuit board, the list of components, the welding and manufacturing instructions and of course the program for uploading the firmware to the microcontroller.
In the lower part, there is also another very important adjustment.
The AS7341 sensor is not perfectly calibrated when leaving the factory.
The photodiodes that measure each wavelength band are covered with a colored filter painted in a different color depending on the wavelength that we want to measure.
But when applied by the manufacturer AMS, it is possible that its color, its thickness varies very slightly.
And then, like all electronic components, there is an uncertainty tolerance for these photodiodes.
So the lower part allows you to shift the spectrum either towards warm colors or towards cold colors depending on the AS7341 sensor you have.
To explain to you.
You have made the box and calibrated it correctly.
But when you photograph a white sheet by putting the white balance in manual with the value of this box, you notice for several light sources (a cold source, a warm source, a neutral source), a shift each time in the blues. Well by playing on the « shift coefficient » you will be able to compensate for this shift. The « shift coefficient » can make a shift of more or less 300K, which is enough to compensate for the drift from one sensor to another.
Temporary storage :
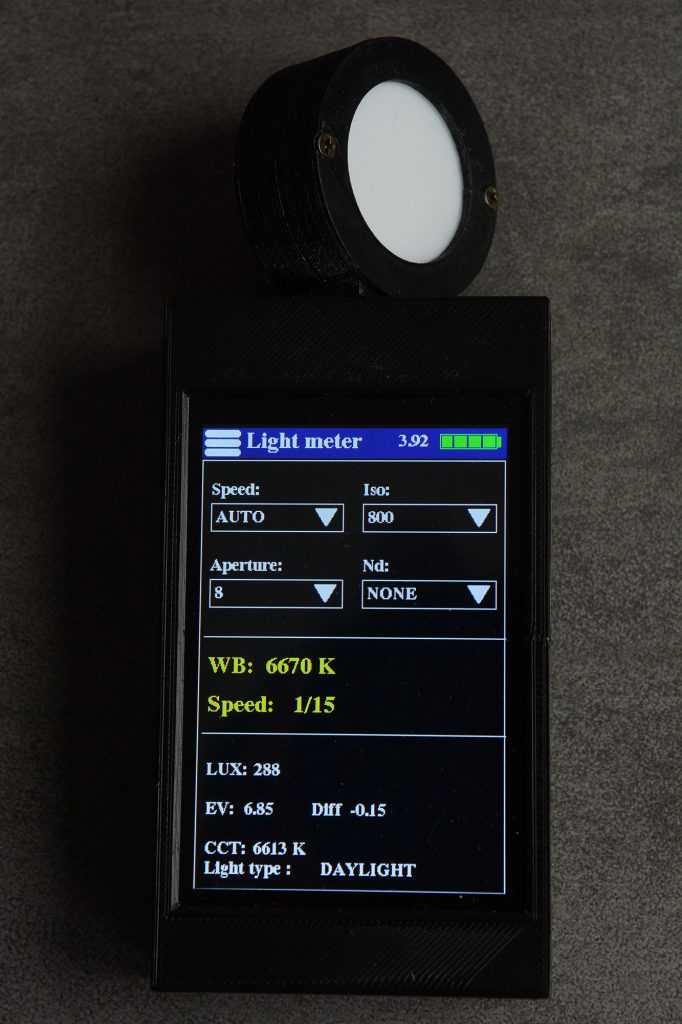
At the beginning of the article, I told you about the role of the push button on the right side of the box.
It is used to turn the box on and off, but it is also used when pressed for less than 1 seconds to temporarily memorize the values in the spectrometer, light meter, CRI and CIE191 mode.
When this is the case, a white rectangle appears around the window as above.
If you press the push button again, the white rectangle disappears, the measurements resume.
The memorization works as long as the box does not go into standby mode and as long as you do not press the push button.
So here is the link to download the ZIP containing all the instructions to make this spectrometer / flash meter / exposure meter yourself (I don’t make any):
http://thierrydphotographe.free.fr/spectrometer_as7341.zip
PS: If you wish, you can give me feedback on your manufacturing and use via my email address which is indicated in the « Contact » section of this site, that would be nice. And why not propose suggestions or improvements to this photographic spectrometer.
PS2: See my other DIY :